Results of Operations, Financial Position and Net Assets
The Volkswagen Group continued its successful course in fiscal year 2014, again generating record sales revenue and operating profit in an ongoing difficult market environment. We successfully completed a voluntary tender offer made to Scania’s shareholders.
The Volkswagen Group’s segment reporting in compliance with IFRS 8 comprises the four reportable segments Passenger Cars, Commercial Vehicles, Power Engineering and Financial Services, in line with the Group’s internal reporting and management.
At Volkswagen, segment profit or loss is measured on the basis of operating profit or loss.
| (XLS:) |
|
KEY FIGURES FOR 2014 BY SEGMENT |
|
|
||||||||||||
|---|---|---|---|---|---|---|---|---|---|---|---|---|---|---|
|
€ million |
Passenger Cars |
Commercial Vehicles |
Power Engineering |
Financial Services |
Total segments |
Reconciliation |
Volkswagen Group | |||||||
|
|
|
|
|
|
|
|
|
|||||||
|
Sales revenue |
164,065 |
30,205 |
3,732 |
24,920 |
222,922 |
−20,464 |
202,458 |
|||||||
|
Segment profit or loss (operating profit or loss) |
11,578 |
901 |
44 |
1,917 |
14,439 |
−1,742 |
12,697 |
|||||||
|
as a percentage of sales revenue |
7.1 |
3.0 |
1.2 |
7.7 |
|
|
6.3 |
|||||||
|
Capex, including capitalized development costs |
14,039 |
1,851 |
166 |
517 |
16,574 |
39 |
16,613 |
|||||||
The reconciliation column contains activities and other operations that do not by definition constitute segments. These include the unallocated Group financing activities. Consolidation adjustments between the segments (including the holding company functions) are also contained in the reconciliation. Purchase price allocation for Porsche Holding Salzburg and Porsche, as well as for Scania and MAN, is in line with their accounting treatment in the segments.
The Automotive Division comprises the Passenger Cars, Commercial Vehicles and Power Engineering segments, as well as the figures from the reconciliation. The Passenger Cars segment and the reconciliation are combined to form the Passenger Cars Business Area. We report on the Commercial Vehicles and Power Engineering segments under the Commercial Vehicles/Power Engineering Business Area. The Financial Services Division corresponds to the Financial Services segment.
Activities in the Passenger Cars segment cover the development of vehicles and engines, the production and sale of passenger cars, and the genuine parts business. This segment combines the Volkswagen Group’s individual passenger car brands on a consolidated basis. It also includes the Ducati brand’s motorcycle business.
The Commercial Vehicles segment primarily comprises the development, production and sale of light commercial vehicles, trucks and buses from the Volkswagen Commercial Vehicles, Scania and MAN brands, the corresponding genuine parts business and related services.
The Power Engineering segment combines the large-bore diesel engines, turbomachinery, special gear units, propulsion components and testing systems businesses.
The activities of the Financial Services segment comprise dealer and customer financing, leasing, banking and insurance activities, fleet management and mobility offerings.
SUCCESSFUL COMPLETION OF THE SCANIA TENDER OFFER
On March 14, 2014, Volkswagen AG made a voluntary tender offer to Scania’s shareholders for all shares not previously held by Volkswagen either directly or indirectly. 36.93% of all Scania shares were acquired on the successful completion of the offer by the end of June. Volkswagen held 99.57% of Scania’s share capital as of the end of the reporting period; this corresponded to 99.66% of the voting rights. Volkswagen has initiated a squeeze-out for the remaining Scania shares. Volkswagen has controlled 100% of the share capital since January 14, 2015. The transaction reduced equity by €6.7 billion. €6.5 billion was paid for the shares acquired in 2014; a liability was recognized in the balance sheet outside profit or loss for the shares to be acquired in the squeeze-out.
To partially fund the transaction, the Company resolved and implemented a capital increase in June 2014, under which new preferred shares were issued from authorized capital against cash contributions, while disapplying shareholders’ preemptive rights. This increased the share capital by a notional €26.8 million and generated gross proceeds totaling €2.0 billion.
Results of operations of the Group
The Volkswagen Group generated sales revenue of €202.5 billion in fiscal year 2014, 2.8% higher than in the previous year. The clearly negative exchange rate effects seen in the first half of the year in particular were offset by higher volumes and improvements in the mix. At 80.6% (80.9%), a large majority of sales revenue was recorded outside of Germany.
Gross profit improved to €36.5 billion (€35.6 billion). Optimized product costs had a positive impact on earnings, while increased depreciation charges resulting from our significant capital expenditures and higher upfront investments in new products had a negative effect. The prior-year figure was impacted by contingency reserves. The gross margin was 18.0% (18.1%).
Although distribution expenses rose as a result of the increase in business, the ratio of distribution expenses to sales revenue remained unchanged. Administrative expenses declined slightly year-on-year, both as an absolute figure and as a proportion of sales revenue. Other operating income rose by €0.7 billion year-on-year to €3.3 billion, mainly due to currency-related factors.
At €12.7 billion, the Volkswagen Group generated its highest ever operating profit in fiscal year 2014, beating the previous record set in the prior-year period by €1.0 billion. Positive volume and mix effects, as well as optimized product costs, were able to offset negative exchange rate effects, increased depreciation charges, higher research and development costs, and greater fixed costs due to growth factors. The prior-year figure had been negatively impacted by contingency reserves. The operating return on sales improved to 6.3% (5.9%).
The Volkswagen Group’s profit before tax rose to €14.8 billion in the reporting period, up 19.0% on the prior-year figure. The return on sales before tax increased from 6.3% to 7.3%. Profit after tax was €1.9 billion higher than in 2013, at €11.1 billion. The tax rate was 25.2% (26.4%).
| (XLS:) |
|
INCOME STATEMENT BY DIVISION |
|
|
||||||||||||
|---|---|---|---|---|---|---|---|---|---|---|---|---|---|---|
|
|
VOLKSWAGEN GROUP |
AUTOMOTIVE* |
FINANCIAL SERVICES | |||||||||||
|
€ million |
2014 |
2013 |
2014 |
2013 |
2014 |
2013 | ||||||||
|
|
|
|
|
|
|
|
||||||||
|
||||||||||||||
|
Sales revenue |
202,458 |
197,007 |
177,538 |
175,003 |
24,920 |
22,004 |
||||||||
|
Cost of sales |
−165,934 |
−161,407 |
−146,311 |
−144,481 |
−19,623 |
−16,926 |
||||||||
|
Gross profit |
36,524 |
35,600 |
31,226 |
30,522 |
5,297 |
5,078 |
||||||||
|
Distribution expenses |
−20,292 |
−19,655 |
−19,199 |
−18,604 |
−1,093 |
−1,050 |
||||||||
|
Administrative expenses |
−6,841 |
−6,888 |
−5,427 |
−5,682 |
−1,414 |
−1,206 |
||||||||
|
Net other operating income |
3,306 |
2,613 |
4,180 |
3,571 |
−874 |
−958 |
||||||||
|
Operating profit |
12,697 |
11,671 |
10,780 |
9,807 |
1,917 |
1,863 |
||||||||
|
Operating return on sales (%) |
6.3 |
5.9 |
6.1 |
5.6 |
7.7 |
8.5 |
||||||||
|
Share of profits and losses of equity-accounted investments |
3,988 |
3,588 |
3,956 |
3,513 |
31 |
76 |
||||||||
|
Other financial result |
−1,891 |
−2,831 |
−1,907 |
−2,858 |
17 |
27 |
||||||||
|
Financial result |
2,097 |
757 |
2,049 |
655 |
48 |
102 |
||||||||
|
Profit before tax |
14,794 |
12,428 |
12,829 |
10,462 |
1,965 |
1,966 |
||||||||
|
Income tax expense |
−3,726 |
−3,283 |
−3,097 |
−2,873 |
−629 |
−410 |
||||||||
|
Profit after tax |
11,068 |
9,145 |
9,732 |
7,590 |
1,336 |
1,555 |
||||||||
|
Noncontrolling interests |
84 |
52 |
43 |
−9 |
41 |
61 |
||||||||
|
Profit attributable to Volkswagen AG hybrid capital investors |
138 |
27 |
138 |
27 |
– |
– |
||||||||
|
Profit attributable to Volkswagen AG shareholders |
10,847 |
9,066 |
9,551 |
7,572 |
1,295 |
1,494 |
||||||||
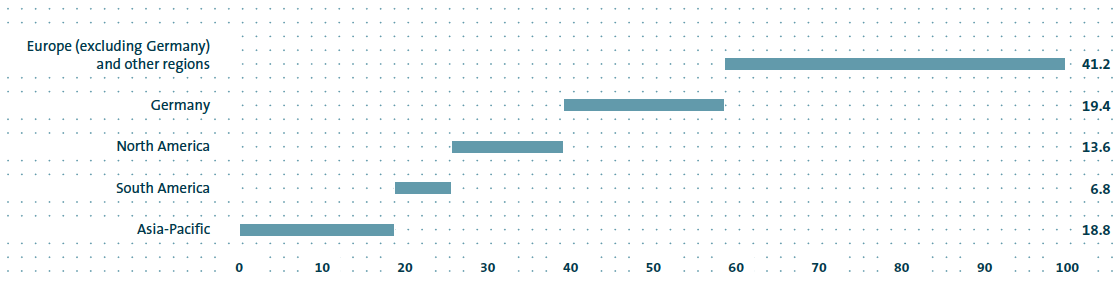
SEGMENT REPORTING – SHARE OF SALES REVENUE BY MARKET 2014
in percent
Results of operations in the Automotive Division
The Automotive Division’s sales revenue rose year-on-year to €177.5 billion (€175.0 billion). The clearly negative exchange rate effects seen in the first half of the year in particular were more than offset by positive volume and mix effects. As our Chinese joint ventures are accounted for using the equity method, the Group’s positive business growth in the Chinese passenger car market is mainly reflected in its sales revenue only by deliveries of vehicles and vehicle parts.
Gross profit in the Automotive Division exceeded the 2013 figure, at €31.2 billion (€30.5 billion). Higher depreciation charges as a result of our significant capital expenditures, increased research and development costs, in particular for new drive concepts, and higher fixed costs due to growth factors were offset by improved product costs. The prior year had been impacted by contingency reserves in the areas of passenger cars and power engineering.
Distribution expenses rose by 3.2% as against the previous year and the ratio of distribution expenses to sales revenue also increased slightly. Administrative expenses and the ratio of administrative expenses to sales revenue decreased. Currency-related factors saw other operating income improve to €4.2 billion (€3.6 billion).
The Automotive Division’s operating profit rose by 9.9% to €10.8 billion in the reporting period. The division recorded an operating return on sales of 6.1% (5.6%). The positive business growth of our Chinese joint ventures is mainly reflected in the Group’s operating profit only by deliveries of vehicles and vehicle parts, as well as license revenue. The profit recorded by the joint venture companies is accounted for in the financial result using the equity method.
The financial result rose by €1.4 billion to €2.0 billion. The increase was due primarily to lower expenses from the measurement of derivative financial instruments at the reporting date, as well as income from the Chinese joint ventures, which was up on the high prior-year figures. In addition, the previous year was impacted by expenses in connection with the control and profit and loss transfer agreement with MAN SE.
| (XLS:) |
|
RESULTS OF OPERATIONS IN THE PASSENGER CARS BUSINESS AREA |
||||
|
€ million |
2014 |
2013 | ||
|---|---|---|---|---|
|
|
|
|
||
|
Sales revenue |
143,601 |
140,077 |
||
|
Gross profit |
26,153 |
25,872 |
||
|
Operating profit |
9,835 |
9,013 |
||
|
Operating return on sales (%) |
6.8 |
6.4 |
||
Sales revenue in the Passenger Cars Business Area increased year-on-year to €143.6 billion (€140.1 billion) in 2014. Gross profit improved to €26.2 billion (€25.9 billion). The Passenger Cars Business Area generated an operating profit of €9.8 billion, up on the prior-year figure (€9.0 billion). The operating return on sales was 6.8% (6.4%). The initially unfavorable exchange rate trends, higher depreciation charges as a result of our significant capital expenditures, increased research and development costs – in particular for new drive concepts – and higher fixed costs due to growth factors had a negative impact. However, these effects were offset by increased volumes, improvements in the mix and lower product costs.
| (XLS:) |
|
RESULTS OF OPERATIONS IN THE COMMERCIAL VEHICLES/ POWER ENGINEERING BUSINESS AREA |
||||
|
€ million |
2014 |
2013 | ||
|---|---|---|---|---|
|
|
|
|
||
|
Sales revenue |
33,937 |
34,927 |
||
|
Gross profit |
5,074 |
4,650 |
||
|
Operating profit |
945 |
794 |
||
|
Operating return on sales (%) |
2.8 |
2.3 |
||
The Commercial Vehicles/Power Engineering Business Area recorded sales revenue of €33.9 billion (€34.9 billion) in fiscal year 2014, of which €3.7 billion (€3.9 billion) was attributable to the Power Engineering segment. Gross profit increased to €5.1 billion (€4.7 billion). Operating profit improved to €0.9 billion (€0.8 billion), while the operating return on sales amounted to 2.8% (2.3%). The difficult conditions in South America and Russia, as well as increased competitive pressure on prices and margins, had a negative impact. At €44 million, operating profit in the Power Engineering segment exceeded the prior-year figure (€−250 million), which had been impacted by project-specific contingency reserves.
Results of operations in the Financial Services Division
The Financial Services Division generated sales revenue of €24.9 billion in fiscal year 2014. The 13.3% year-on-year increase was mainly attributable to higher business volumes.
Gross profit improved by 4.3% year-on-year to €5.3 billion.
The higher volumes and compliance with regulatory requirements pushed up distribution and administrative expenses in the reporting period. While the ratio of administrative expenses to sales revenue increased, the ratio of distribution expenses to sales revenue declined. Other operating income amounted to €−0.9 billion (€−1.0 billion).
Operating profit at the Financial Services Division rose by 2.9% year-on-year to €1.9 billion, with the division again making a significant contribution to the Group’s success. Aside from compliance with regulatory requirements, the main challenge in the reporting period was the ongoing pressure on margins. The operating return on sales declined to 7.7% (8.5%). The return on equity before tax was 12.5%, as against 14.3% in the previous year.